Read previous: Searching for Malware 3: Trending Topics Exploiting
In this part, David and Paul speak more specifically on Twitter usage patterns they retrieved, and outlined a number of distinct user groups on the network.
Paul Judge: We dug into the different networks, and we dug into Twitter – that’s a good example because their API is so open, it gives us the ability to easily ask questions, but on the other side it also gives the attackers the ability to kind of also easily create lots of accounts and also easily inject lots of content for very little costs, in terms of computing and bandwidth.
We have about a little over 25 million Twitter accounts that we’ve analyzed. So you think about this whole set of over a 100 million Twitter accounts that exist, we have access to over 25 million of those that we’ve examined. It’s pretty substantial sample, or subset of the Twitter universe.
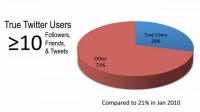
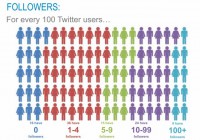
After looking at that, one of the first questions that we wanted to ask was – what’s an actual Twitter user, what’s a true Twitter user? I’m sure most people in this room are true Twitter users. And we set the bar pretty low: we say a true Twitter user is somebody that has in at least 10 tweets, they have at least 10 people following them, and they are following at least 10 people (see diagram). This is a pretty low bar for you guys that have actually used the network. But what we saw is only 29% of the accounts on the network meet those criteria. Just think of about it, 71% of the accounts on Twitter really aren’t using it. So this was kind of the first thing that we noticed, I mean the vast majority of the network is not using it. We looked at it a little more closely, and what we saw was how many followers each account had (see image). The point here is 16% of the accounts have no followers. Think about this. Basically 1 in every 6 accounts on the network – nobody is listening to them. You know, over half of the network, 52% of the network, have less than 5 followers. So a couple of people listening, but not many people care. But it’s interesting only 9% of the network has over a 100 followers – so a very small set of the overall population of people are tuning in to them and listening to what they’re saying.David Maynor: What’s funny, it seems the Twitter has become high school again – there are some people known to only 5 people, and then there are people that everybody knows.
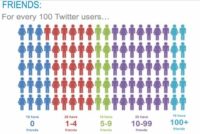
Paul Judge: Exactly. So that’s kind of the set of who is following (see image). The thing we looked at next is how many people you are following. And the point here again is – out of all the accounts on Twitter, 19% of them are not following anybody. They went on and created an account, and they don’t care to listen to anyone, 1 out of 5 accounts following nobody. There’s only 10% of the accounts that are following more than 100 people, so only 10% of the people are interested enough to actually pay attention around the clock.The next thing we looked at, it’s kind of more interesting, was the relationship between those 2 numbers. You know, if you think about normal social network, you are following the same number of people that are following you; if you think about Facebook, Myspace – it’s a mutual relationship, it’s kind of a two-way connection, whereas with Twitter you have this opportunity to have it one way.
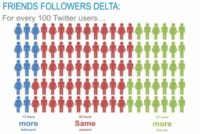
And so what we saw was that 55% of the network is actually using it with a kind of a two-way pattern (see image). They have roughly the same number of people following them as they’re following, plus or minus 5, that’s the criteria that we used. So 55% of the network is using it like a normal social network. What we saw was that 13% have more followers than the number of people they are following. The other side is – 32% of the network is following more people. So it really shows that about half the network are using it like friends, there are about 13% that are celebrities, and there are about 30% that are consumers of content.One other thing we wanted to look at was how many of these are real accounts, how many of these are legitimate people and legitimate accounts. So we looked to examine this thing that we call the Twitter crime rate. And the Twitter crime rate is the percentage of accounts every month that are created and then suspended. And these are suspended by Twitter. So this is obviously not all the accounts that are doing things that are malicious, but at least a measure over time of how many accounts were created doing malicious misuse and then kicked off the network.
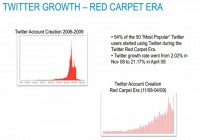
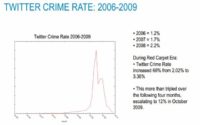
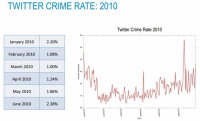
Let’s look back since the beginning of the network (see image). This top left view is the view since the beginning of the network, the growth of the network. This is the user growth of Twitter since 2006. One of the interesting things that we saw is this Red Carpet Era. If you look at this from November 2008 to April 2009, what happened is, you know, all the celebrities came. So if you look at the top 100 people on Twitter today, 50% of them joined the same 6-month period. So the Ashton Kutchers, the Kim Kardashians all over the world joined the network during this 6-month period. If we look at what it did to the growth rate of Twitter, it went from 2% to 20% a month, in a 6-month period. So what happened there is we know that where the users go, the attackers go. So let’s look at the Twitter crime rate since the beginning of the network (see graph). So since 2006 when the network first started, there was 1% of the accounts that were created in any given month, that were suspended or kicked off by Twitter. You look at 2007 – it went up to 1.7%. In 2008, it went to 2.2%. In the middle of this Red Carpet Era, it increased 66%: from 2.02% to 3.36%. But 4 months later the crime rate jumped to 12%. So 1 in very 8 accounts that were created on this network were being kicked off. And again, these are only the ones that were being found. It then came back down as the user growth simmered down. If we look at what we have seen so far this year (see graph), it’s gone from 2% to 1%, and it fluctuated in that range, so the average this year is 1.6% of the accounts that were created any given month and being kicked off for misuse or inappropriate activities. And again, these are only the ones that were identified successfully.To be continued…
